Viewing Nebula Logs
This guide explains how to view logs for Nebula in each of the supported platforms. Please note that these instructions are approximations as there are many ways that Nebula can be installed.
Linux
These instructions assume that you either installed Nebula using your distribution's package manager or by copying the example systemd unit from the Github repository.
Logs
journalctl --unit=nebula --follow
Service status
systemctl status nebula
# outputs
● nebula.service - Nebula overlay networking tool
     Loaded: loaded (/etc/systemd/system/nebula.service; enabled; vendor preset: enabled)
     Active: active (running) since Wed 2022-11-30 16:07:48 CST; 2min 3s ago
   Main PID: 546 (nebula)
      Tasks: 10 (limit: 4560)
     Memory: 19.2M
     CGroup: /system.slice/nebula.service
             └─546 /usr/local/bin/nebula -config /etc/nebula/config.yml

# ... shows nebula logs ...
macOS
These instructions assume that Nebula was installed using brew install nebula on Apple Silicon.
On Intel processors, Homebrew uses /usr/local instead of /opt/homebrew as a default prefix.
Logs
sudo tail -f /opt/homebrew/var/log/nebula.*
Another useful tool for viewing logs is the built-in Console.app.
To access the logs, select File -> Open from the menu and then press Cmd + Shift + G
in the file picker, which will allow you to enter /opt/homebrew/var/log/nebula.log into the textbox.
Service status
launchctl list homebrew.mxcl.nebula
{
	"StandardOutPath" = "/opt/homebrew/var/log/nebula.log";
	"LimitLoadToSessionType" = "Aqua";
	"StandardErrorPath" = "/opt/homebrew/var/log/nebula.log";
	"Label" = "homebrew.mxcl.nebula";
	"OnDemand" = false;
	"LastExitStatus" = 256;
	"Program" = "/opt/homebrew/opt/nebula/bin/nebula";
	"ProgramArguments" = (
		"/opt/homebrew/opt/nebula/bin/nebula";
		"-config";
		"/opt/homebrew/etc/nebula/config.yml";
	);
};
Windows
These instructions assume that Nebula was installed using the nebula -service install command.
Logs
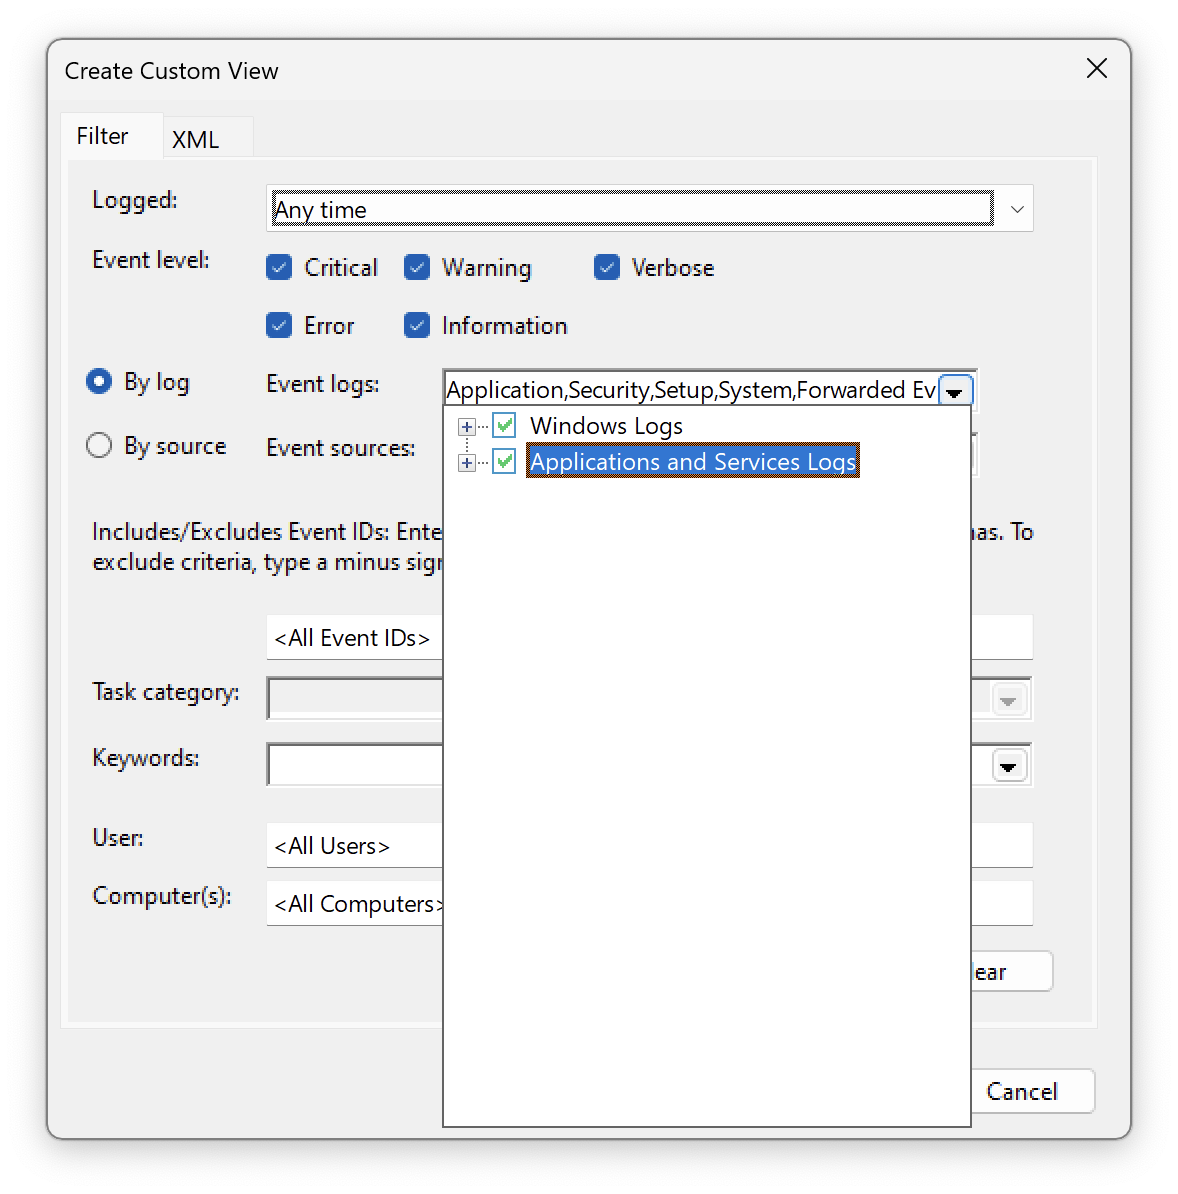
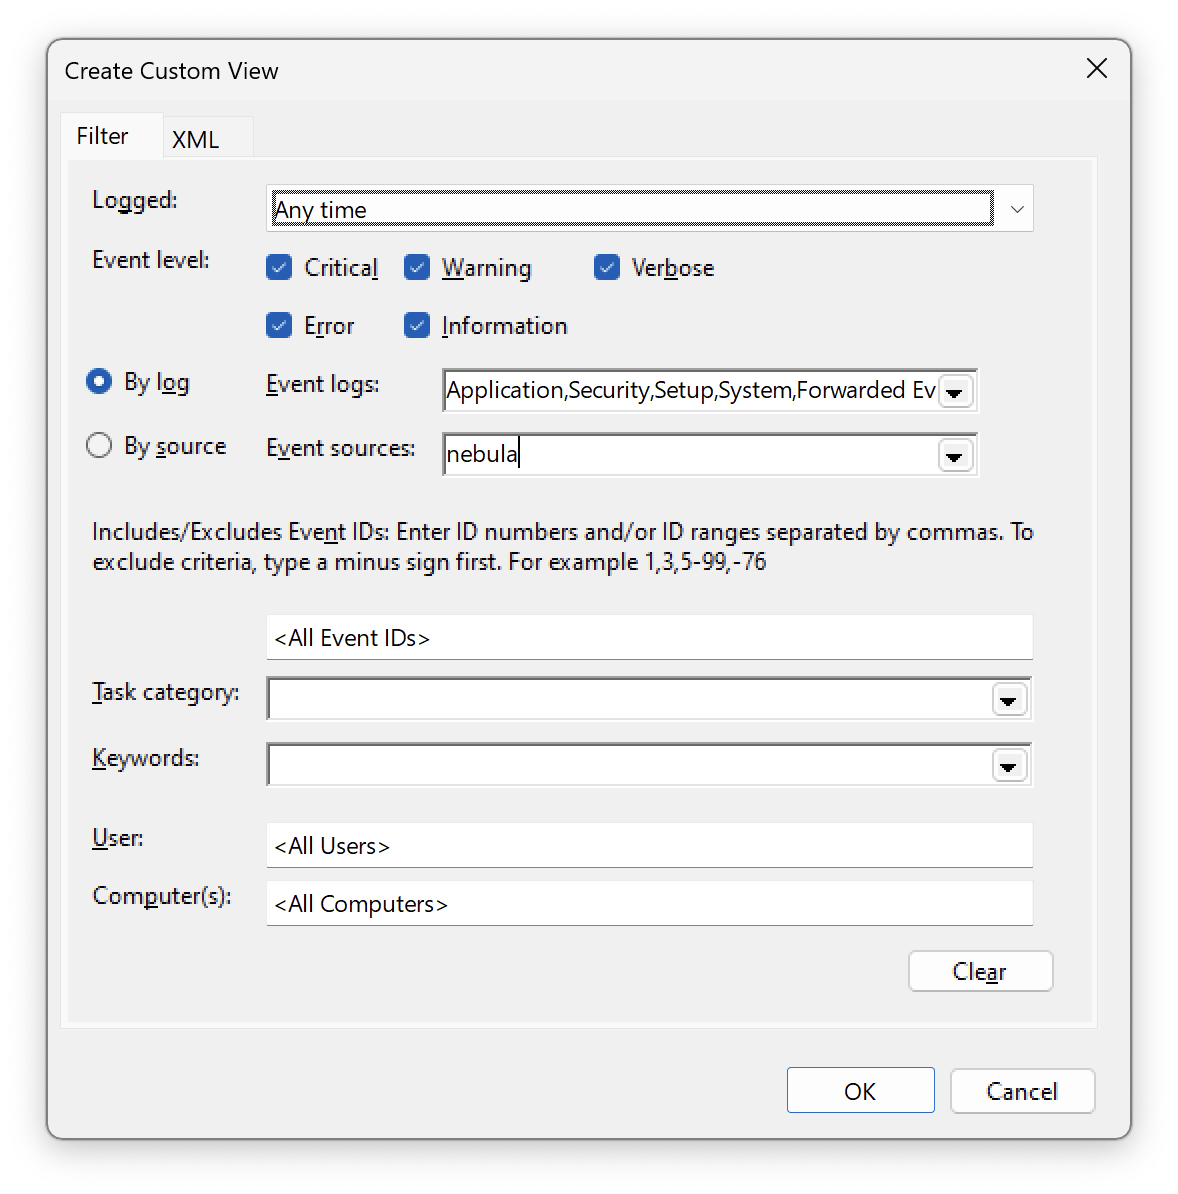
Open the Event Viewer app, click on Custom Views -> Administrative Events -> manually enter nebula for "Event
sources".
You can also make a "Custom View" which filters on the nebula source.
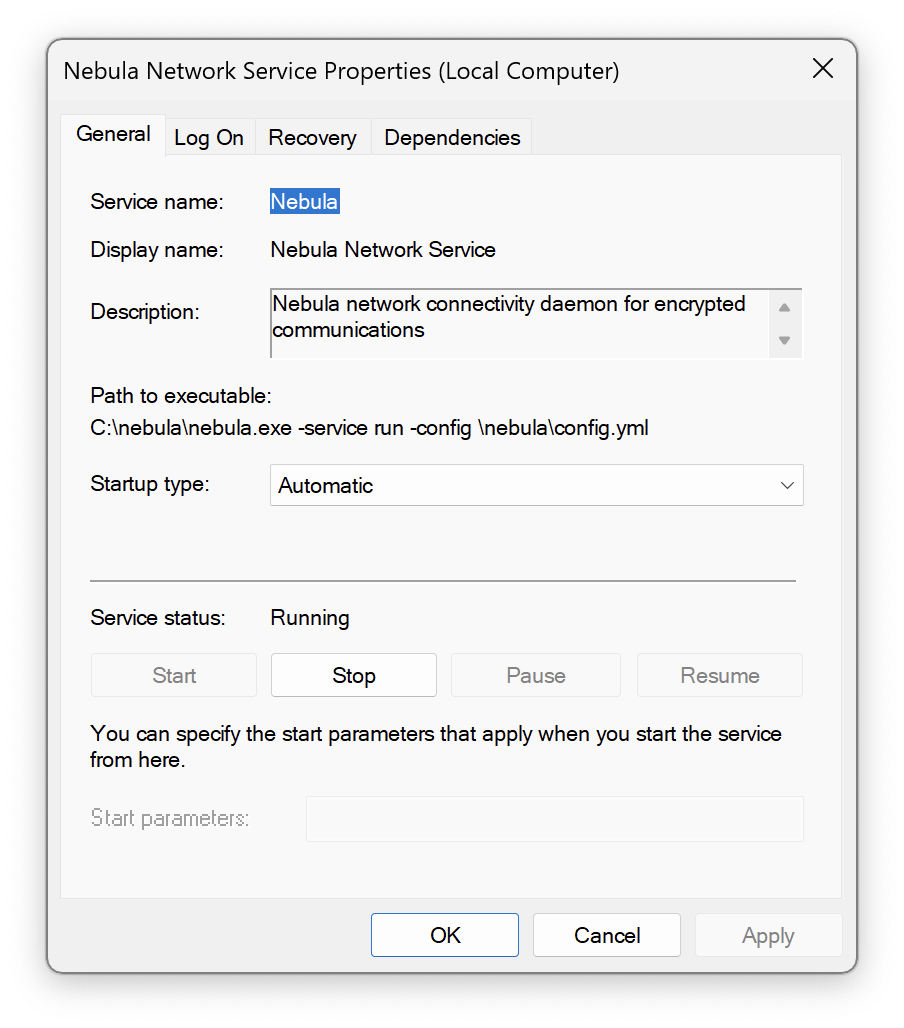
Service status
To check the status of the service, open Services app, and find the Defined Networking Client service in the list. You should be able to see the status and start or stop the service.
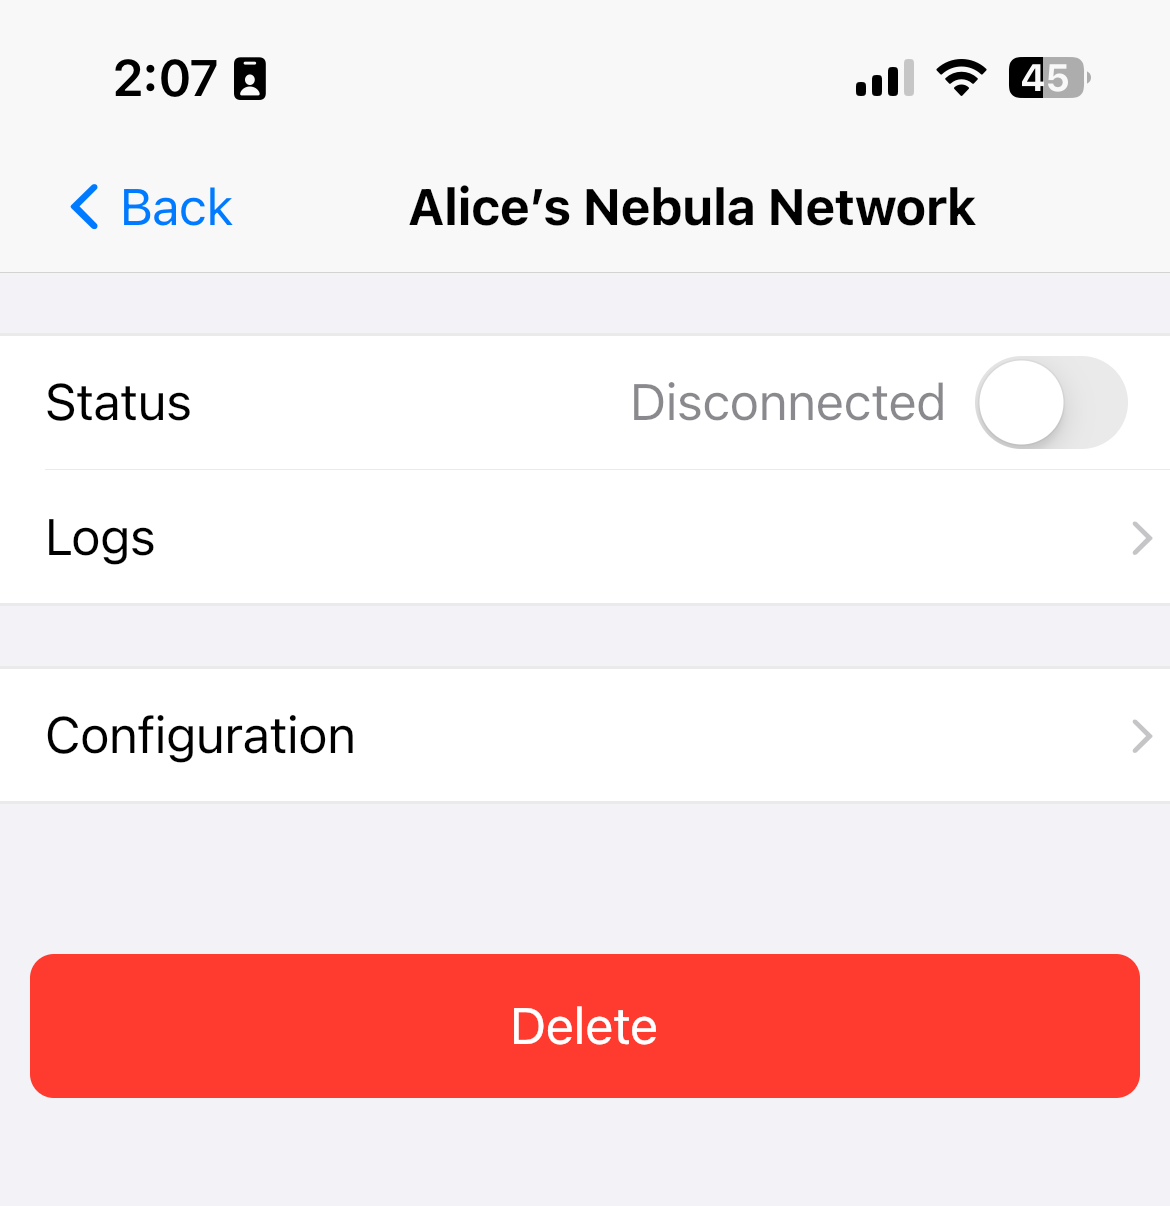
Android / iOS
Logs
Tap on the site in question and tap "View Logs" on the details page for that site. You can then read, share, or delete your logs.
Logs are cleared each time a site is started.